CyberDefenders - Trigona Ransomware / Water Ungaw Lab
Learn to investigate ransomware attacks by analyzing logs, registry entries, and artifacts to trace attacker actions, tools used, and identify indicators of compromise.
Intro Text
As a forensic investigator at IResponseDash, you are tasked with examining a ransomware attack that has compromised multiple endpoints. Your primary objective is to determine the delivery method of the ransomware and to trace all activities of the attacker to understand the progression of the attack.
To accomplish this, you will analyze logs, review system and network activities, and gather evidence of the attacker's actions. This investigation will allow you to provide recommendations for addressing the current incident and enhancing defenses to prevent future attacks.
A link to the lab can be found here: https://cyberdefenders.org/blueteam-ctf-challenges/trigona-ransomware-water-ungaw/
Questions
-
Knowing the IP address of the machine that initiated the attack helps trace the attack's origin. What is the IP address of the attacker's machine?
Starting out, to traverse the logs more efficiently, I started by using
EvtxECmd.exeto join all of theevtxfiles into a singlecsvfile, to be able to filter it better usingTimelineExplorer.exePS C:\Users\Administrator\Desktop\Start Here\Artifacts\IT-Machine\Evidence-IT\C\Windows\System32\winevt\logs> EvtxECmd.e xe -d . --csv "C:\Users\Administrator\Desktop\out.csv" (...) Records included: 64 Errors: 0 Events dropped: 0 Metrics (including dropped events) Event ID Count 400 8 403 8 600 48 Processed 120 files in 57.9760 secondsI started by analyzing RDP events for the initial breach, as it is one of the most common vectors for these kinds of attacks, and by filtering by event ID 4625, which pertains to failed RDP Login Attempts, I was able to find an IP address that looked like it was trying a bruteforce attack to login to the machine.
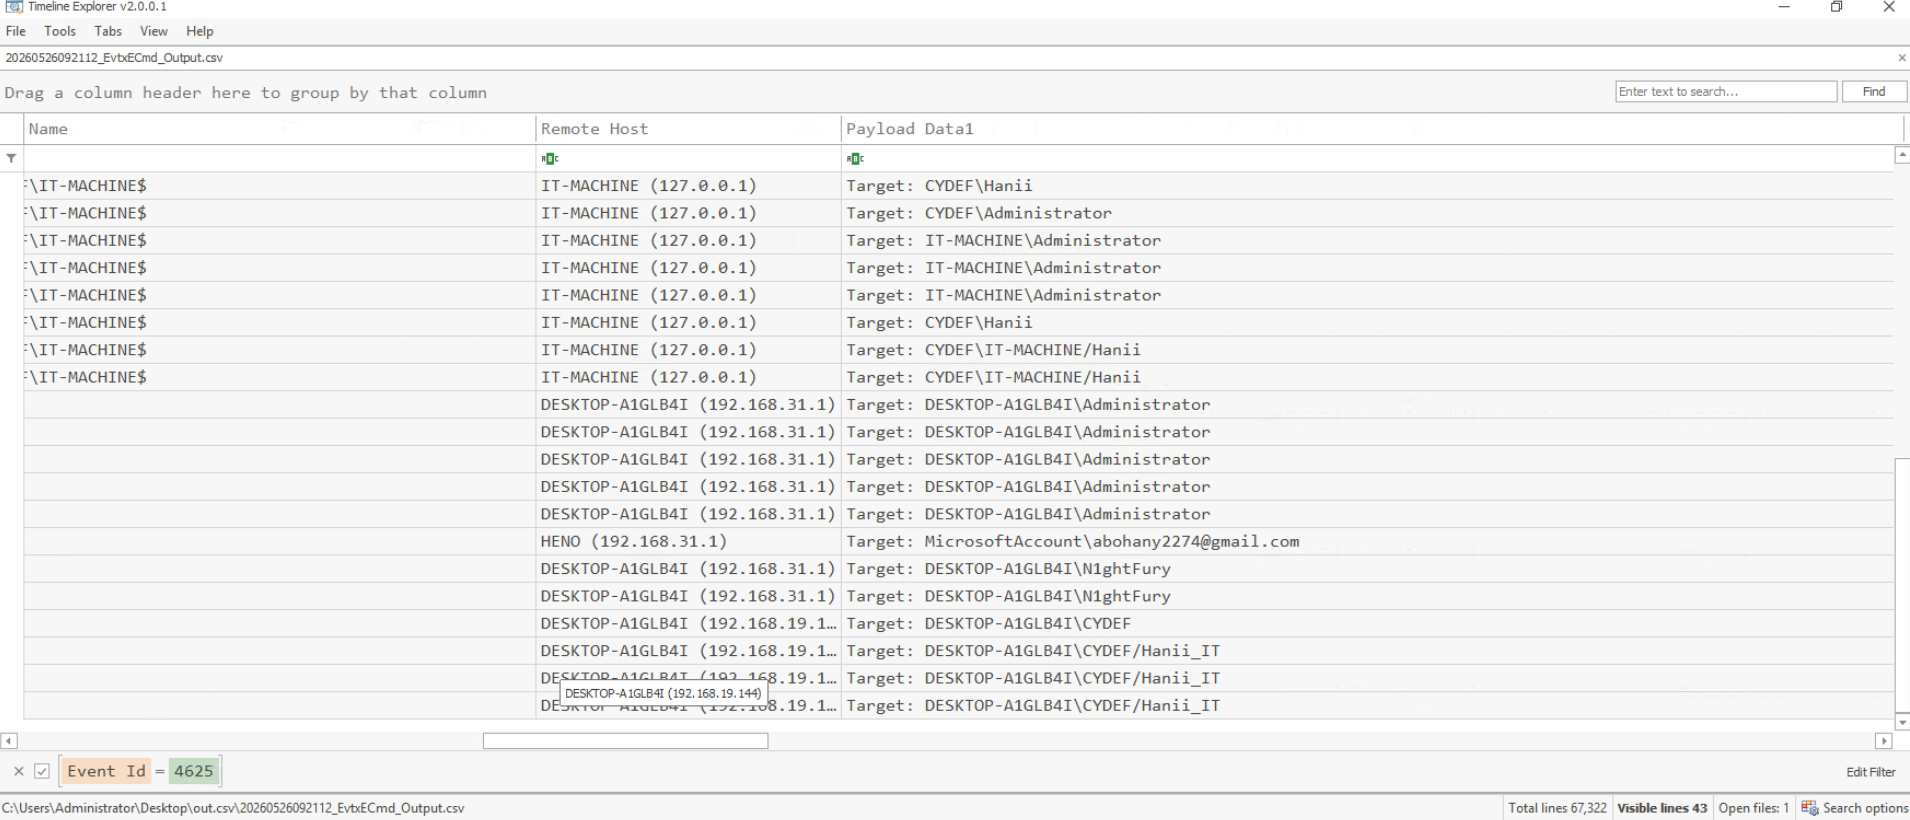
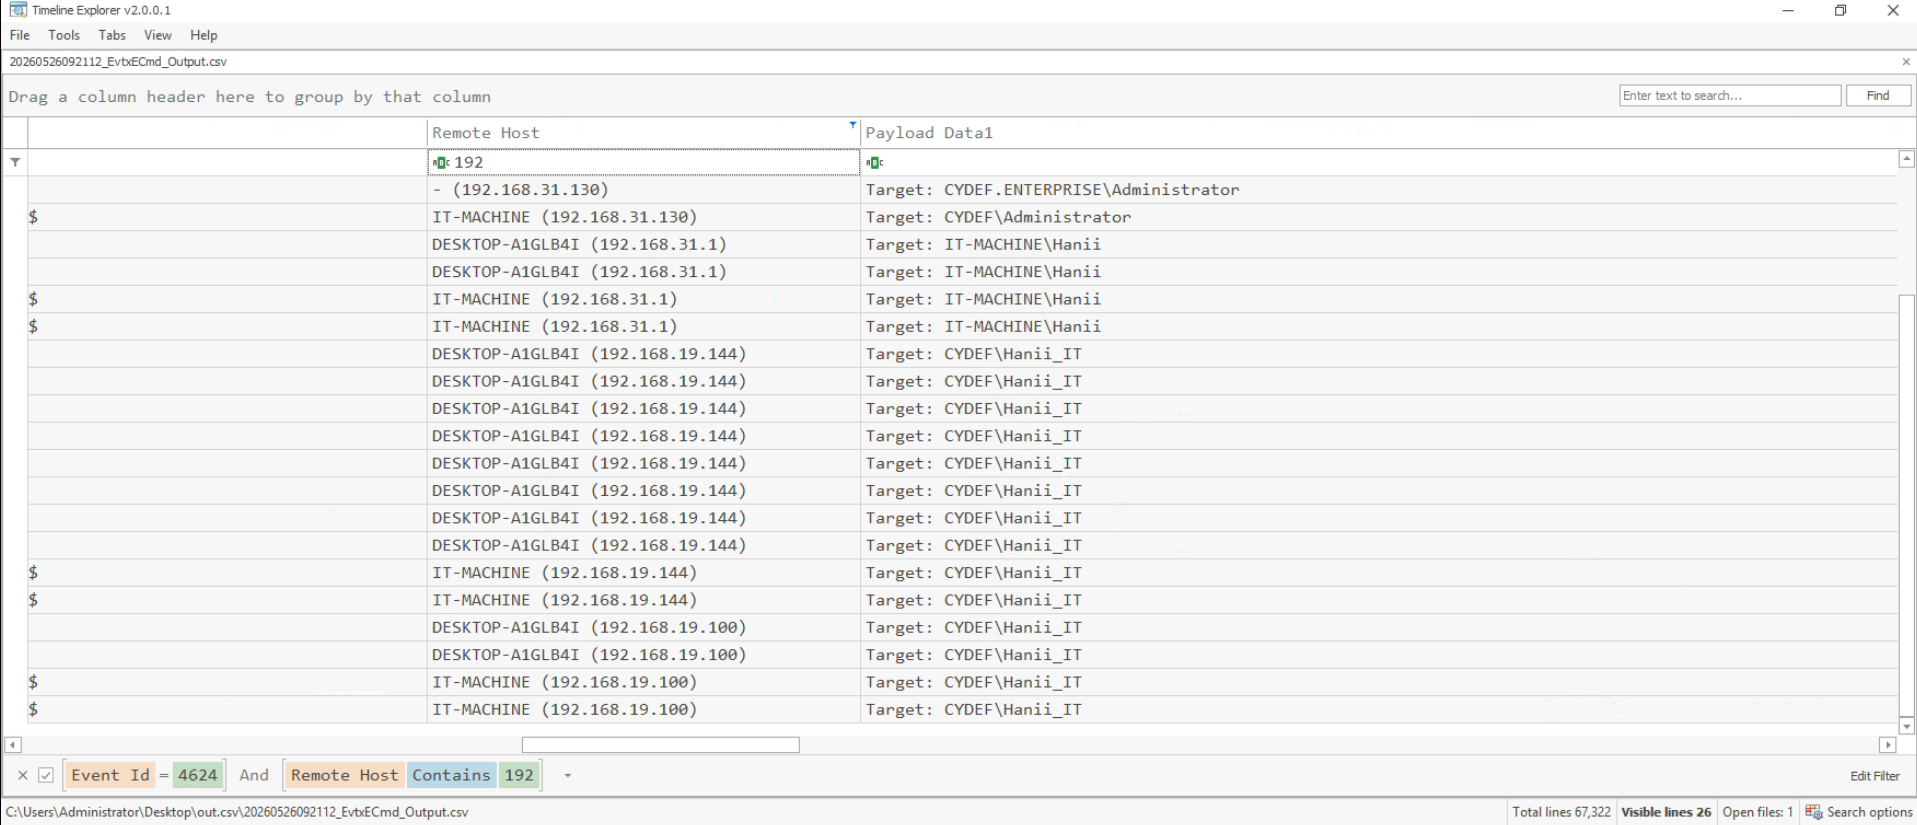
This IP wasn't the answer, so I started filtering by successful logins, but there were too many results, so I filtered them by making sure the Remote Host field contained 192, as it was the starting octet of the IPs I found before (and to remove all the entries that were local logins and had no remote address associated). After that, I scrolled down and the first event had the IP the lab was looking for: 192.168.19.100 .
-
Knowing the account used by the attacker helps track activities and identify compromised accounts. What is the SID of the account the attacker used to gain initial access on the victim machine?
The first victim account was
CYDEF\Hanii_IT, and scrolling over to the Payload field inTimelineExplorerwe can see the account's SID{"EventData":{"Data":[{"@Name":"SubjectUserSid","#text":"S-1-5-18"},{"@Name":"SubjectUserName","#text":"IT-MACHINE$"},{"@Name":"SubjectDomainName","#text":"CYDEF"},{"@Name":"SubjectLogonId","#text":"0x3E7"},{"@Name":"TargetUserSid","#text":"S-1-5-21-1393444541-2628512620-2908104607-1112"},{"@Name":"TargetUserName","#text":"Hanii_IT"},{"@Name":"TargetDomainName","#text":"CYDEF"},{"@Name":"TargetLogonId","#text":"0x1322417"},{"@Name":"LogonType","#text":"10"},{"@Name":"LogonProcessName","#text":"User32 "},{"@Name":"AuthenticationPackageName","#text":"Negotiate"},{"@Name":"WorkstationName","#text":"IT-MACHINE"},{"@Name":"LogonGuid","#text":"00000000-0000-0000-0000-000000000000"},{"@Name":"TransmittedServices","#text":"-"},{"@Name":"LmPackageName","#text":"-"},{"@Name":"KeyLength","#text":"0"},{"@Name":"ProcessId","#text":"0x408"},{"@Name":"ProcessName","#text":"C:\\Windows\\System32\\svchost.exe"},{"@Name":"IpAddress","#text":"192.168.19.100"},{"@Name":"IpPort","#text":"0"},{"@Name":"ImpersonationLevel","#text":"%%1833"},{"@Name":"RestrictedAdminMode","#text":"%%1843"},{"@Name":"TargetOutboundUserName","#text":"-"},{"@Name":"TargetOutboundDomainName","#text":"-"},{"@Name":"VirtualAccount","#text":"%%1843"},{"@Name":"TargetLinkedLogonId","#text":"0x13223E6"},{"@Name":"ElevatedToken","#text":"%%1843"}]}} -
Identifying PowerShell commands reveals attackers' activities such as avoiding detection. What was the first PowerShell command the attacker used for defense evasion?
I auto-piloted and started filtering by Sysmon Event ID 1, but was soon met with the realization that there was no Sysmon Logs to fall back on 😭, so I just filtered the "Provider" to contain powershell in the name and I sorted the events by their "Time Created" field and scrolled looking at the "Payload Data 1" field until I saw some common signs of attacks. And there It was, our old friend
Set-MpPreference -DisableRealtimeMonitoring $true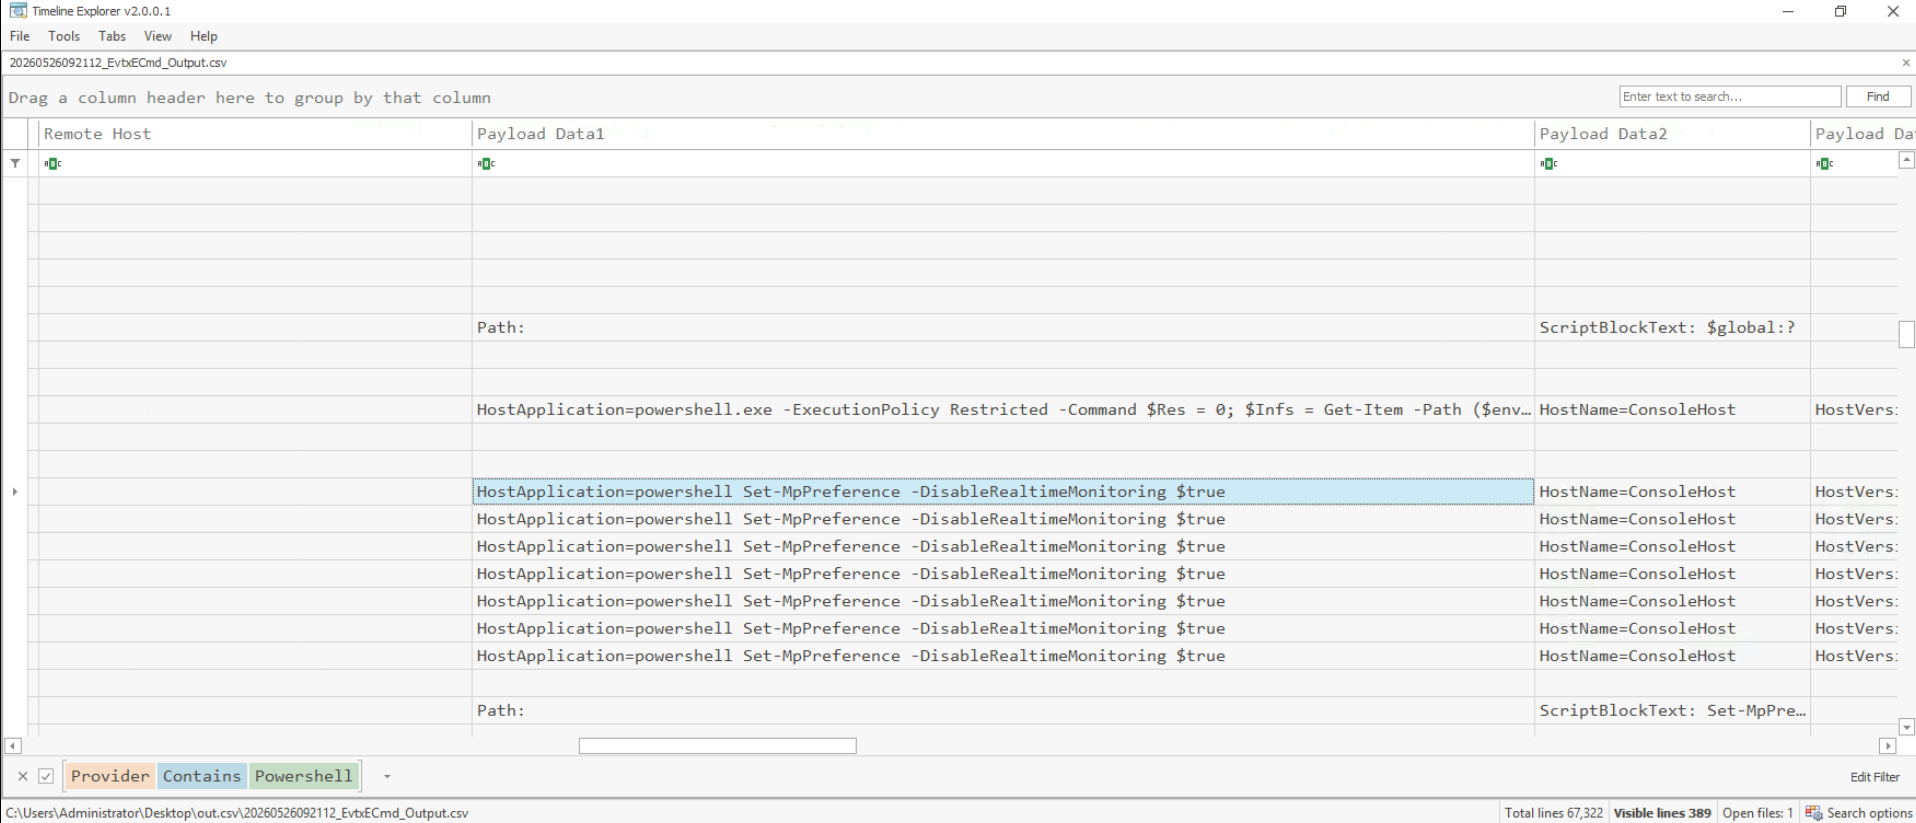
-
We need to find the enumeration output file revealing the network information gathered by the attacker. What is the TXT filename output of one of the network enumeration activities performed by the attacker?
According to this link, we can find the most recently used files by a user in this folder:
%UserProfile%\AppData\Roaming\Microsoft\Windows\**Recent, so we can take a look inside it to see if there's anything interesting there. We can see that there's a link to a txt file calledipallin this folder, which could indicate network enumeration.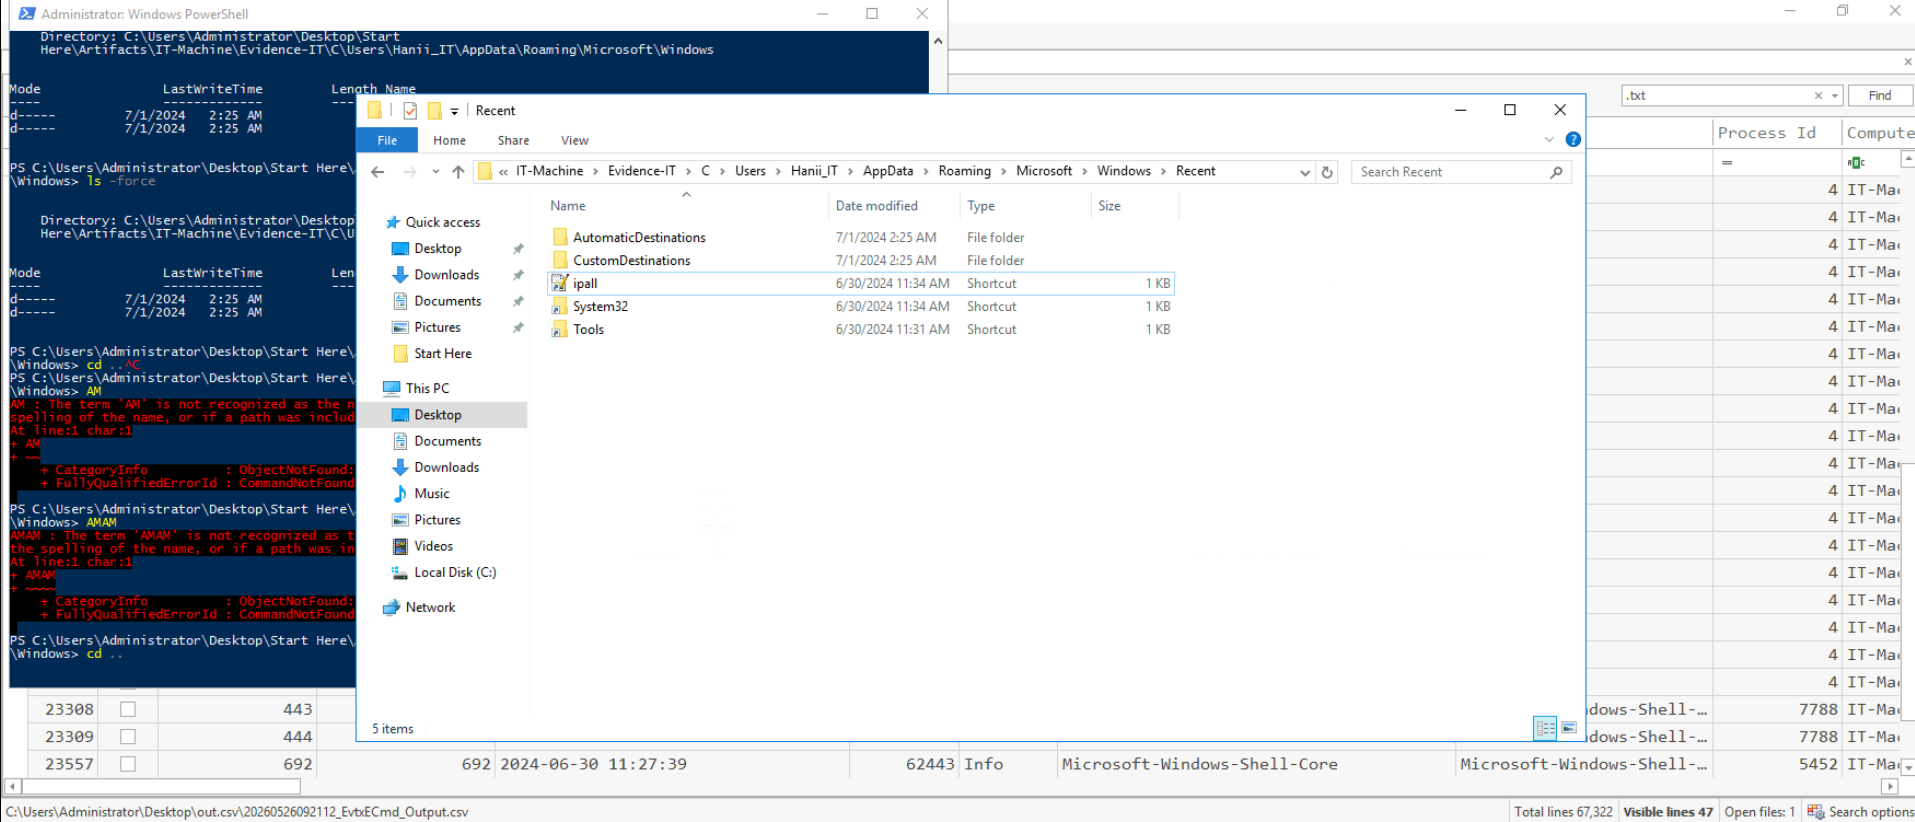
-
Identifying the tools used reveals the methods and scope of network enumeration. After gathering basic information about the network, what third-party tool did the attacker use to identify the file share and perform network enumeration?
I was initially clueless on how to search for this without sysmon logs, but the hint suggested that we should look for prefetch files. So I searched for information about it and found this blogpost containing information about prefetch analysis and suggesting the usage of
PECmd.exeto parse the files.Looking at that output inside
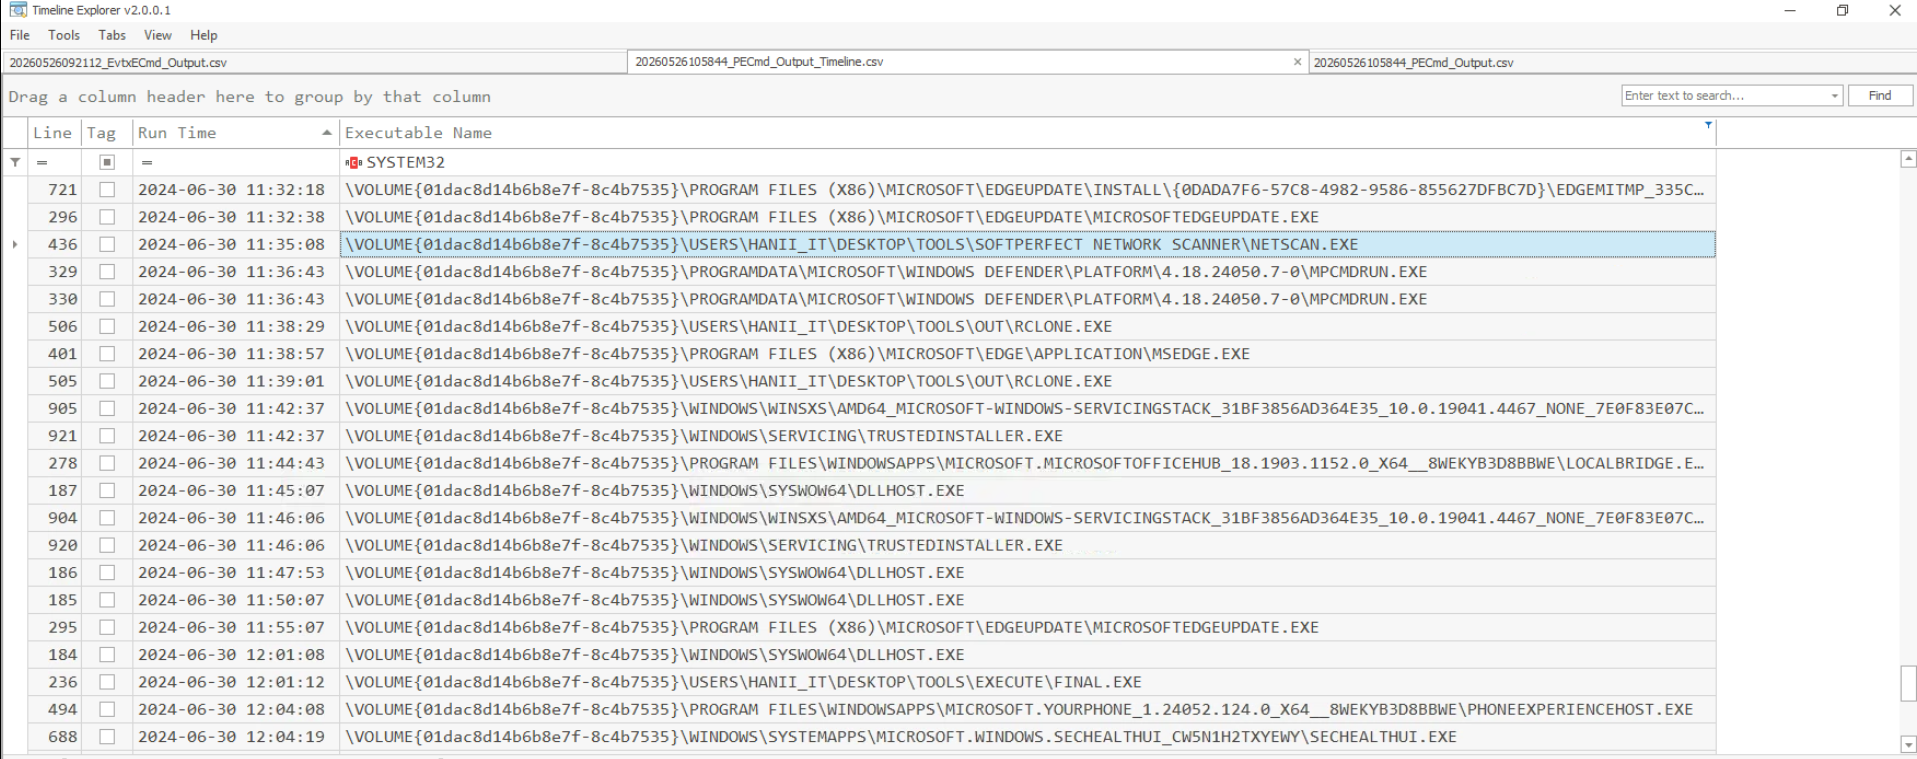
TimelineExplorer, we can see some activity around the time of our intrusion (11:30-ish on the 30th), includingNETSCAN.exe, which is a common tool used to exfiltrate data, and looking at theOutput_Timelinefile fromPECmd.exe, we can see that it was ran from a folder on the desktop of the compromised user.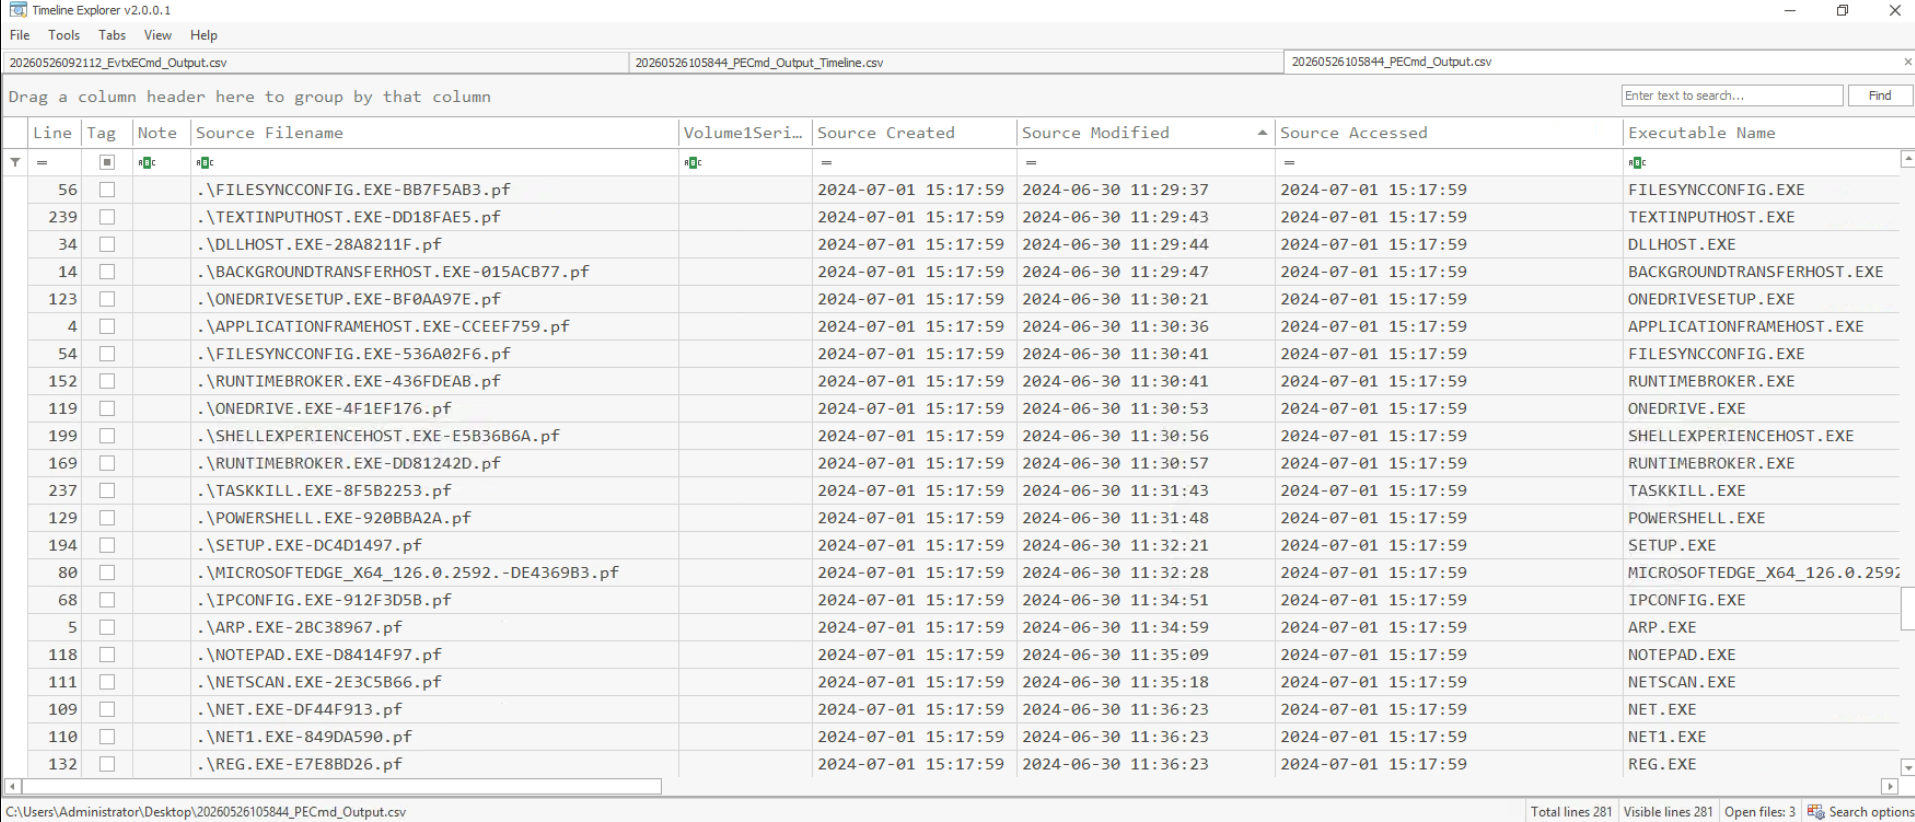
-
Knowing the tool used for data exfiltration helps in identifying the methods and channels used by the attacker to exfiltrate sensitive data. What command line tool did the attacker use to attempt data exfiltration?
Looking at the screenshot above, we can see another tool being used in a similar location to
netscan.exe,rclone.exeis being used to attempt exfil. -
Identifying the IP addresses of the machines involved in lateral movement helps map the attacker's path and understand the attack's scope. Can you provide the IP address of the machine to which the attacker moved laterally and the IP address of the initial access machine?
According to this blog (also from cybertriage), we can find our IP Address over on
HKEY_LOCAL_MACHINE\SYSTEM\ControlSet001\Services\Tcpip\Parameters\Interfaces\, looking inside the present interfaces, we find one with IPs inside the192.168.31.0/24subnet, the same one as we were looking at before when looking at RDP logins, and we can see that our IP which was attributed via DHCP is192.168.31.129, so we can go back to the RDP Logins and try to figure out where the attacker tried to move to.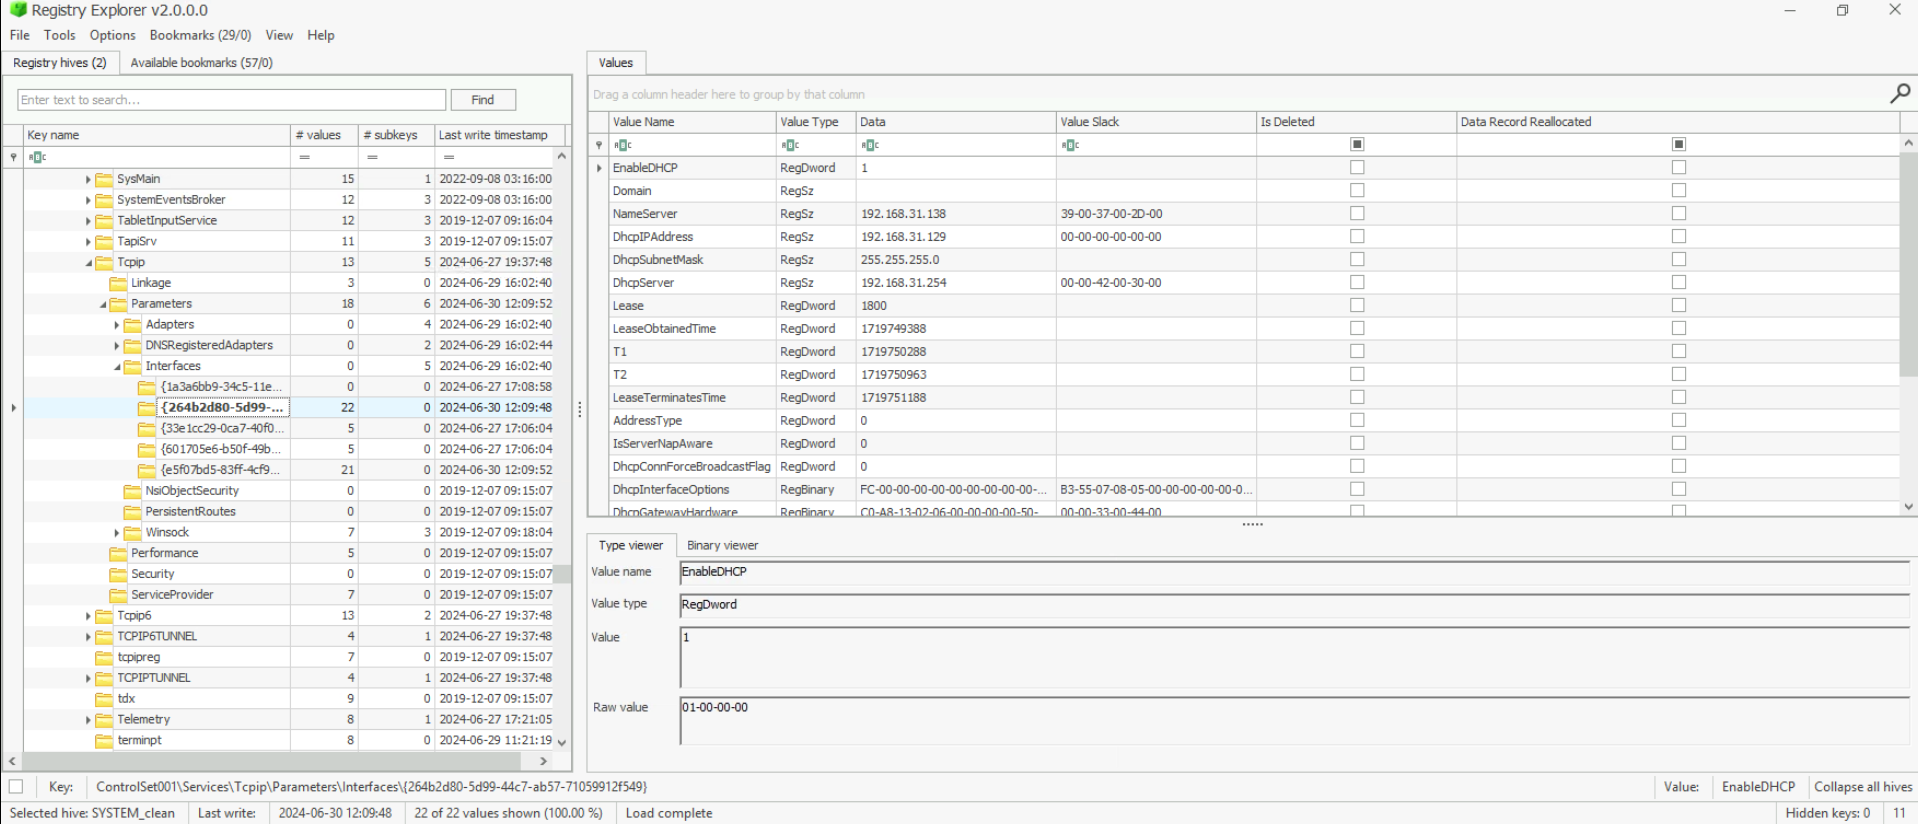
Looking at RDP logs, we can see that the attacker logged on to multiple IPs in the network we were looking at, but the one that we're looking for is
192.168.31.130.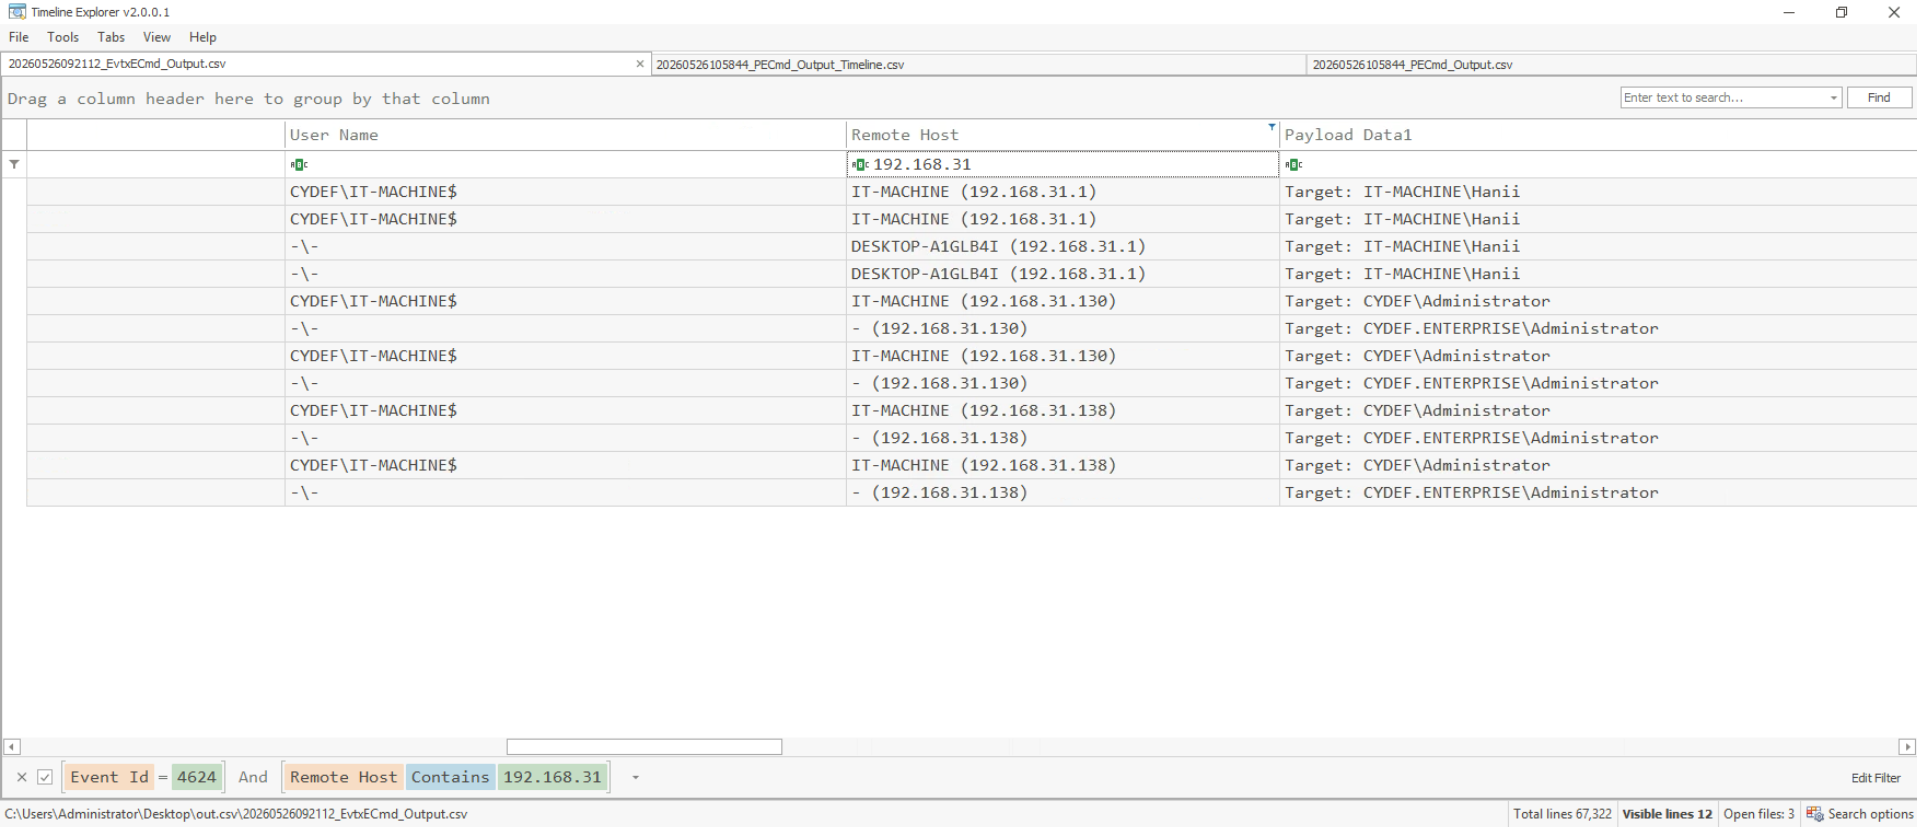
-
Knowing the path of the file share targeted by the attacker helps in identifying compromised data and understanding the attack's impact. What is the full path of the file share on the file server that was targeted by the attacker ?
I searched the registry for this under
SOFTWARE\Microsoft\Windows\CurrentVersion\Explorer\MountPoints2as it was the most commonly suggested key to search, but found nothing, I could only find it after looking at the "hint" that suggested to look intoHKEY_LOCAL_MACHINE\SYSTEM\CurrentControlSet\Services\LanmanServer\Shares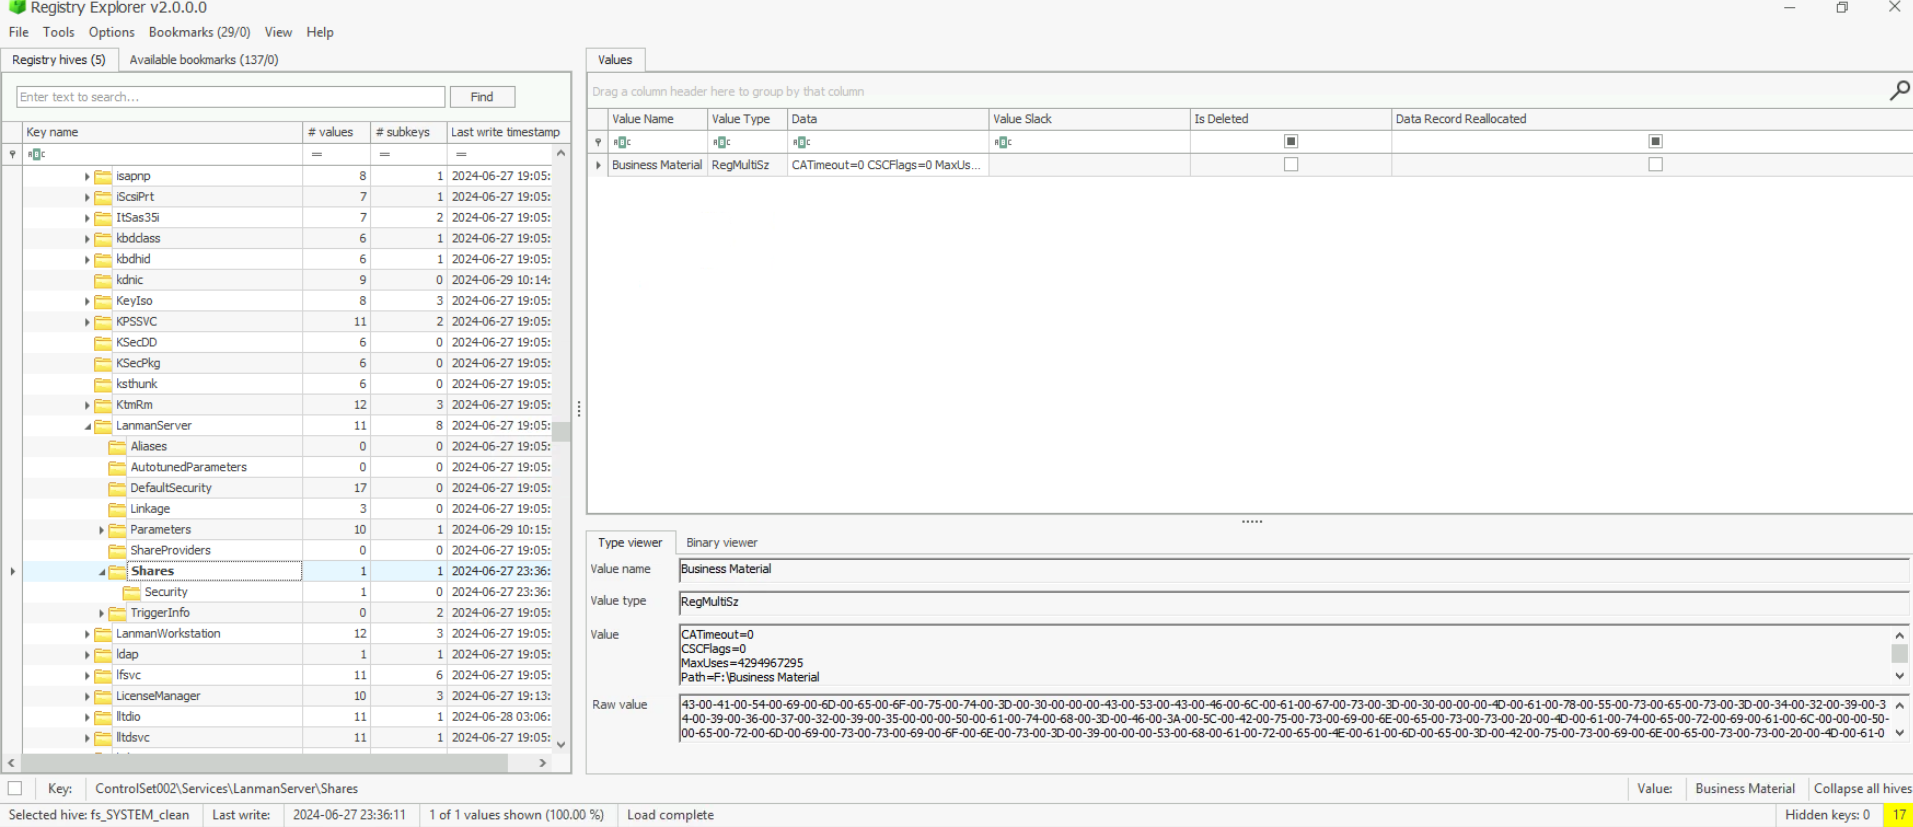
The share was
F:\Shares\Business Material -
Identifying the SHA1 file hash of the malware helps in verifying the exact malicious file and correlating it with known malware signatures. What is the SHA1 file hash of the ransomware run on the file server and IT-machine? I used
AmcacheParserto filterAmcache.hve, so we can have information about executed commands in the system. Afterwards, I loaded the file in TimelineExplorer and filtered for files that contained "tools" in their path, as that was the location where the attackers previous files had been run from.PS C:\Users\Administrator\Desktop\Start Here\Artifacts\IT-Machine\Evidence-IT\C\Windows\AppCompat\Programs> AmcacheParse r.exe -f .\Amcache.hve --csv 'C:\Users\Administrator\Desktop\' AmcacheParser version 1.5.1.0 Author: Eric Zimmerman (saericzimmerman@gmail.com) https://github.com/EricZimmerman/AmcacheParser Command line: -f .\Amcache.hve --csv C:\Users\Administrator\Desktop\ (...) Found 101 unassociated file entry Results saved to: C:\Users\Administrator\Desktop\ Total parsing time: 0.873 seconds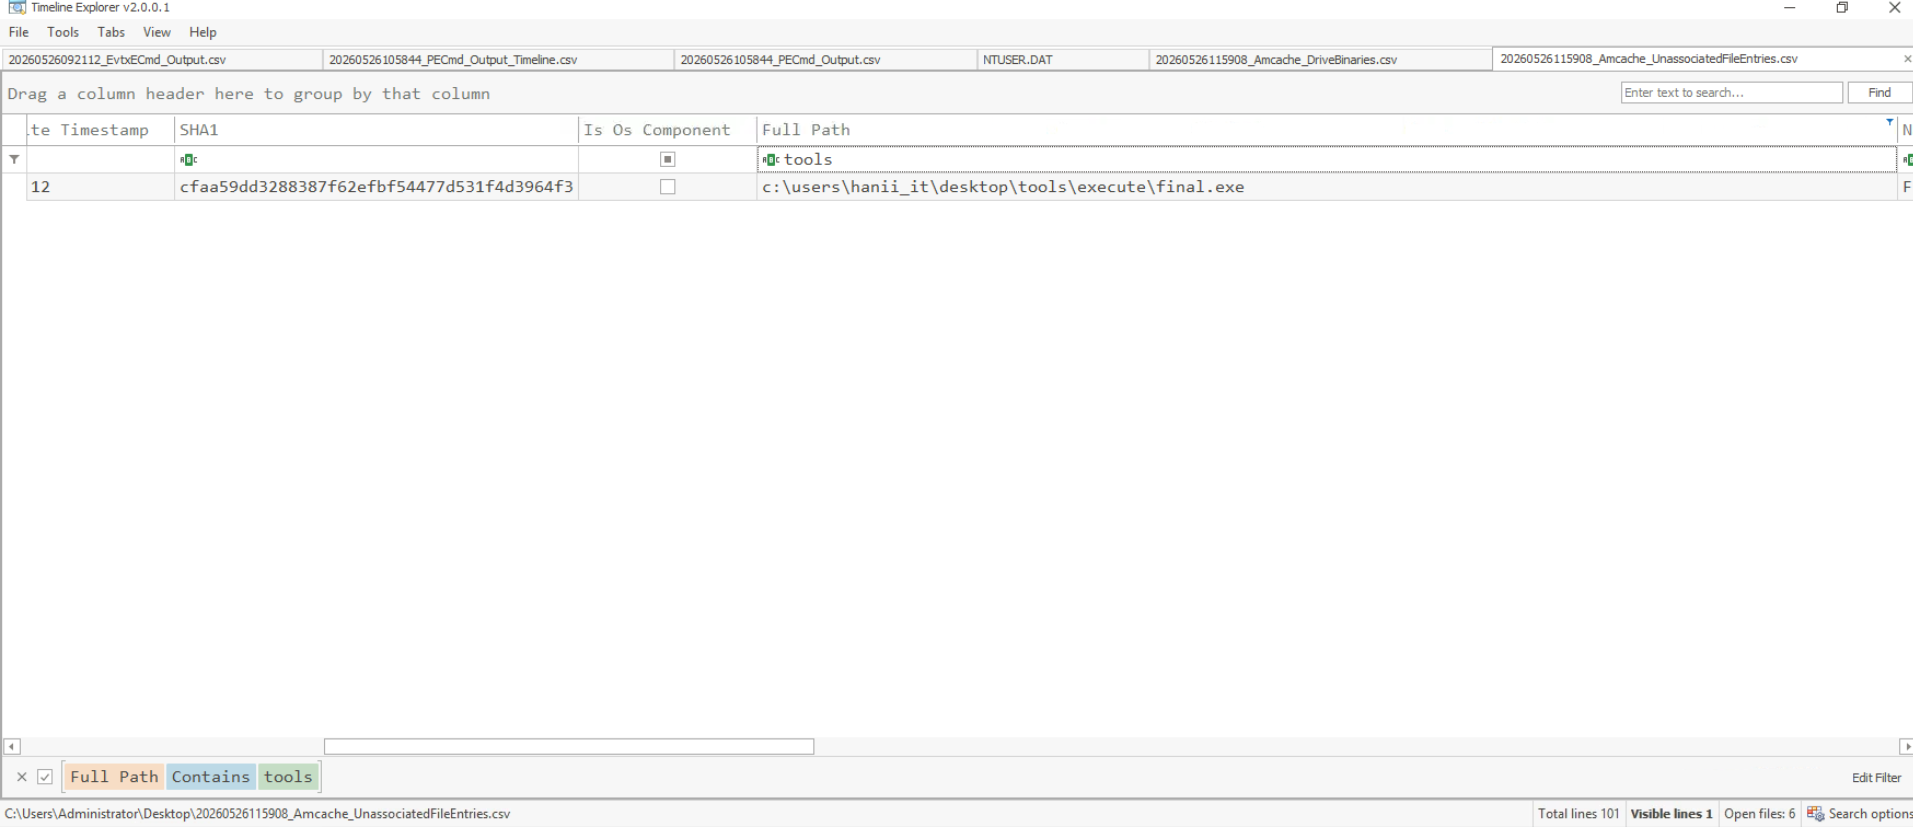
From this, we were able to obtain the
sha1hash of a file we can suspect of being ransomware, plugging it intoVirusTotalquickly confirms our suspicions though, so we can submit this as the answer.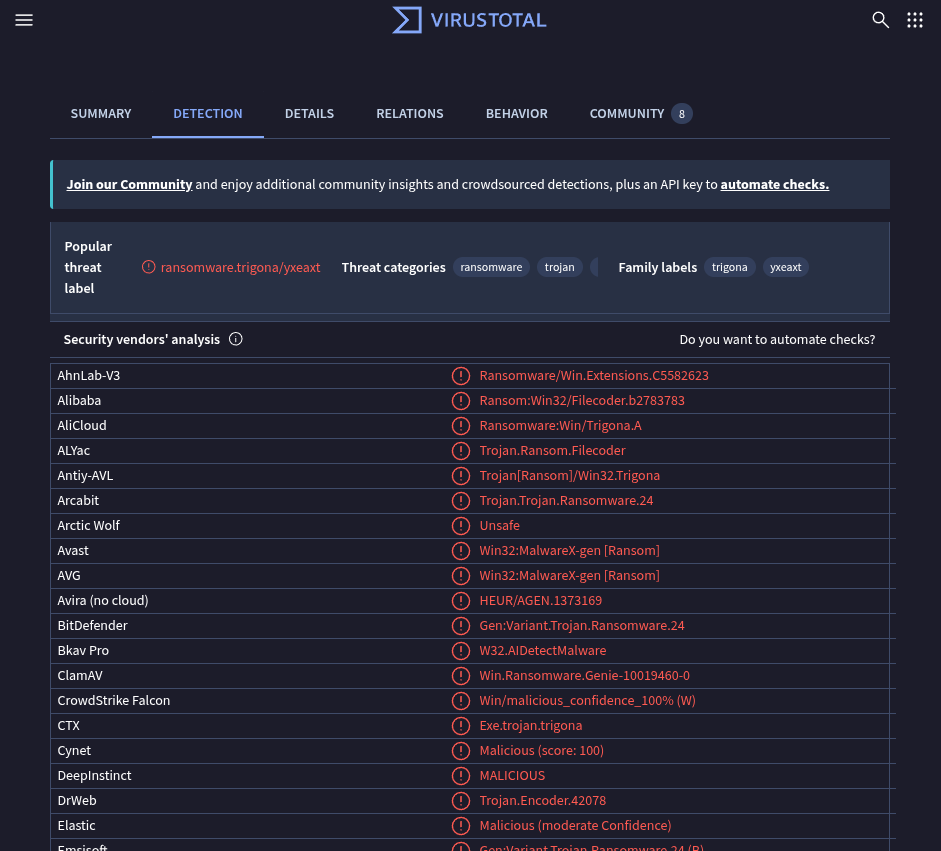
-
Knowing the extension of encrypted files can potentially help us with identifying the ransomware variant. What is the file extension of the encrypted files?
Following the hint, as I always seem to forget what the
$MFTis 😭, we can useMFTECMD.exeto analyze the files on the disk.PS C:\Users\Administrator\Desktop\Start Here\Artifacts\IT-Machine\Evidence-IT\C> MFTECmd.exe -f ".\`$MFT" --csv C:\Users\Administrator\Desktop\ MFTECmd version 1.2.2.1 Author: Eric Zimmerman (saericzimmerman@gmail.com) https://github.com/EricZimmerman/MFTECmd Command line: -f .\$MFT --csv C:\Users\Administrator\Desktop\ File type: Mft Processed .\$MFT in 39.5365 seconds .\$MFT: FILE records found: 298,232 (Free records: 0) File size: 291.2MB CSV output will be saved to C:\Users\Administrator\Desktop\20260526121014_MFTECmd_$MFT_Output.csvThe resulting file is huge, and therefore a pain to filter, but we know that the ransomware was ran at 12:01:12 from the analysis for the last question, so we can start our search around that timestamp. I started by searching the file in TimelineExplorer, and grouped the files by extension. So I was able to find the
._vNrFy5extension.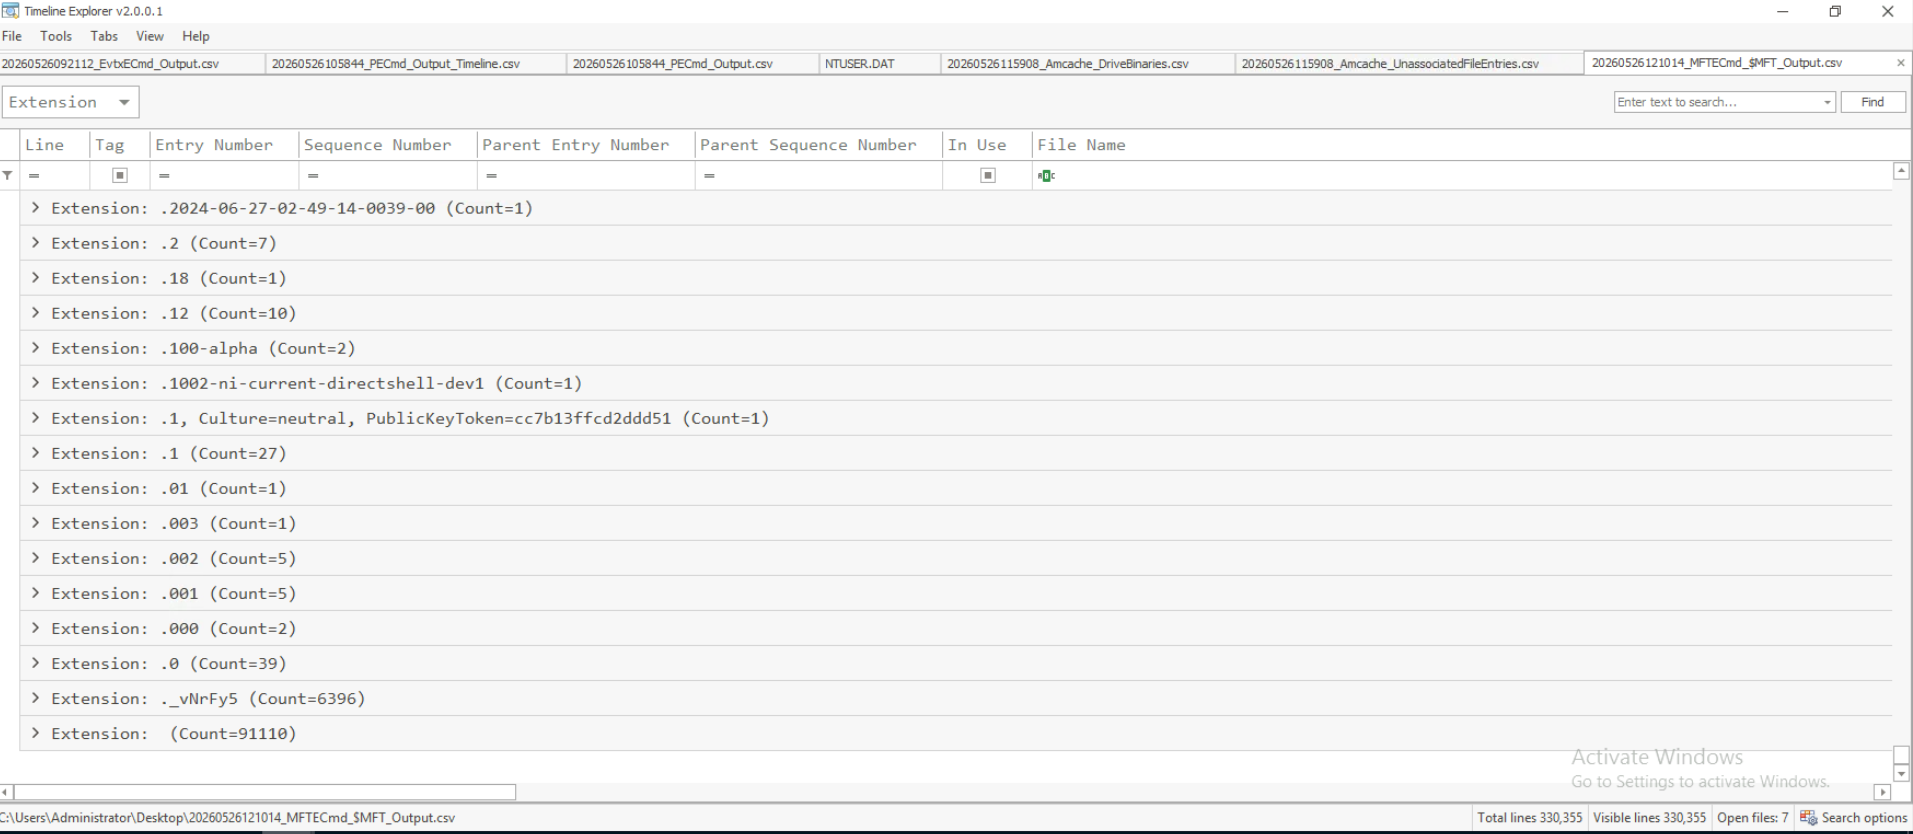
-
Determining the registry modifications by the malware is crucial for identifying its malicious activities. What registry value did the malware add to display its ransom message?
The registry key that has files that are "auto-ran" when a user logs in is
HKEY_CURRENT_USER\Software\Microsoft\Windows\CurrentVersion\Run, so if we look inside it we can find what we're looking for!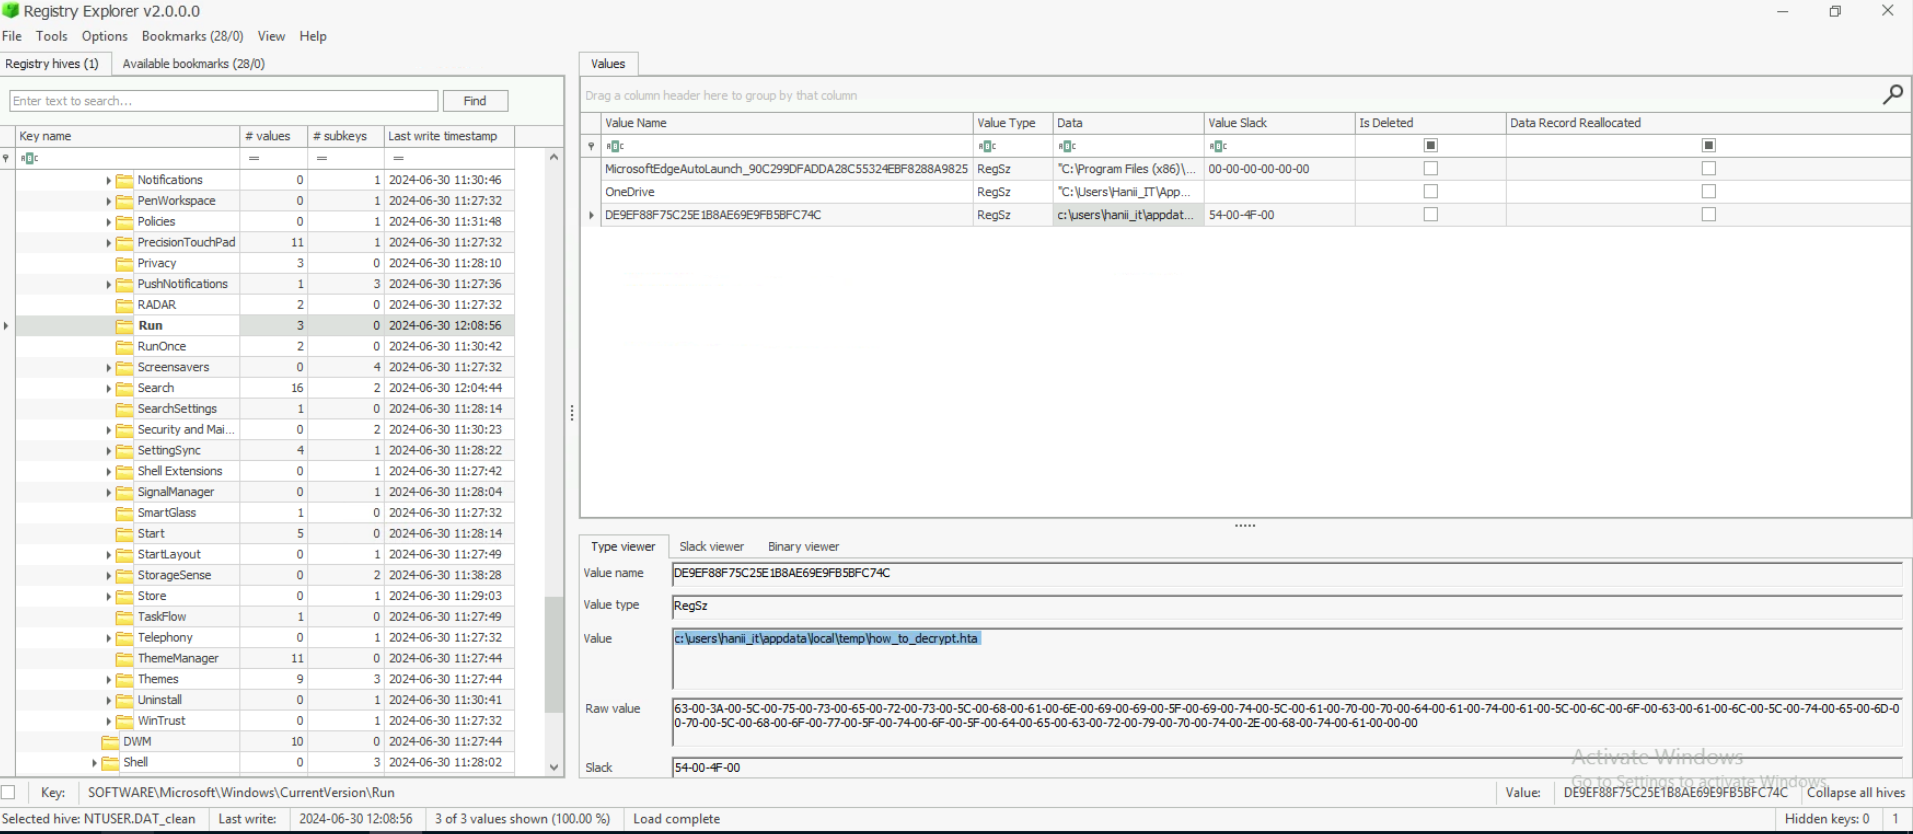
Conclusion
This one was a toughie for me! But I learned a lot while doing it, and felt like I'm starting to develop a workflow for these, which is always nice to feel.
Have a good one,
Bernardo